When you think of process control, what usually comes to mind is some form of technology (e.g. automation, robotics, an app, etc.). However, even with the most advanced computer controls, many processes still fail to achieve the desired output. And often, manufacturers may find processes that seem to work well at times but seemingly fail for no good reason at others.
Most organisations will then conclude that it must be their people causing these failures. And that with more experienced or better-trained employees, the problems would go away. What they don’t account for, however, is the process variations can affect the end result.
What is Process Variation?
All processes will have some variation. You will never get the exact same result each time the process is used.
In manufacturing, the variation might manifest itself through a particular quality characteristic. For example, a process wherein a product should have a diameter of 27 mm, but in reality, the diameter will vary each time. Therefore, a better strategy is to analyse the process itself. By setting up tolerances we can know when the variation exceeds what we believe will work for the customer.
Now we know that all processes vary but what kind of variation is it? There are 2 types of variation in manufacturing – inherent and special cause.
Inherent Variation
Inherent Variation is the amount of variation that one should expect, without being a cause for alarm. For example, the temperature and the humidity vary naturally every day, and it affects the output of many processes (e.g. plastic injection molding, powder coating, wood cutting). As long as both of these parameters are within an acceptable range, the variation of the output (e.g. the weight of the cut wood pieces) is acceptable.
Special Cause Variation
Special Cause Variation is larger than just the inherent level. It is likely to be caused by something other than the changes in the process input or conditions. For example, the paint material or the paint spraying gun has an issue. Another name for this is noise and signal respectively. If engineers keep responding to noise, they will often increase the amount of variation in the system. If they react when there is a signal and their countermeasure is appropriate and effective, they will usually get the process back in control.
How do you manage Process Variations?
So variation happens, but how can you know when it will occur and how much? If you wait until a large amount has been produced, you must then spend money inspecting it. Then if the variation exceeds the tolerances, you will need to spend additional money either scrapping or reworking the product.
That is where Statistical Process Control (SPC) can be used. While it seems to have fallen out of favor over the last couple of decades, it is a powerful tool that can help with making better decisions for your processes.
What is Statistical Process Control?
A process control chart is a core tool of SPC, and is designed to separate the signal from the noise or special cause variation from common cause variation. On paper, this is simple but the ramifications it has throughout the process are significant.
If there is an inherent variation (noise) but that variation is enough to cause problems with either downstream processes or the customer, it is tempting to make some type of adjustment in the process. But if all the variations are inherent, changes to the process will only increase the variation and make things worse. This will happen whether or not a human is making any decisions within the process itself.
Real-World Example of SPC
Years ago, I was working with a company that had a high-tech device measuring the variability in a process. This would automatically adjust their process when the variation reached a certain level.
I asked the operators to turn off the auto-adjust feature for a while to compare the difference variation with and without it. After the testing period, they were astonished to learn that the auto-adjuster increased process variability by a factor of about 2.
The process was actually stable and the only variation it produced was inherent. The only way to reduce that type of variation is to change the process, not just through adjustments.
Using a Process Control Chart to Manage Variations
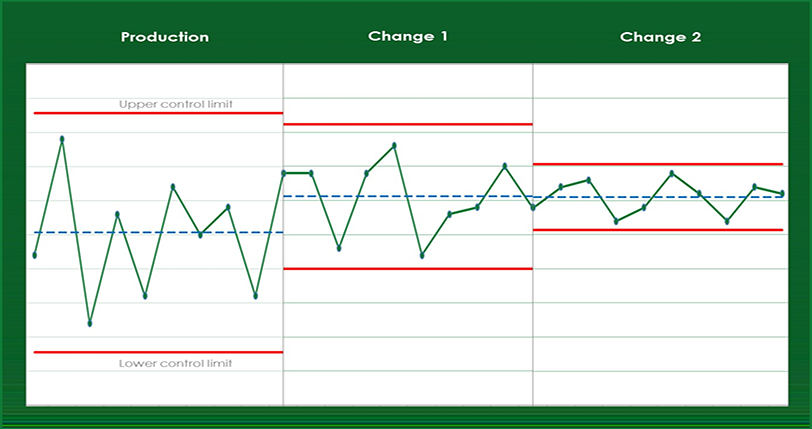
So how exactly can a control chart help us understand the variation and how to deal with it? In short, it determines the inherent variability in a process by establishing control limits that are calculated using the data from the process.
These limits represent the amount of variation that can be expected from this process if it is stable. As long as we see the process running within these limits, we can safely assume that the variation is inherent and any reduction in variation must come through systemic changes.
On the other hand, if we see variations that go outside these limits, we can assume that it is a signal and that something has changed in the process. Of course, the signal could indicate a change in the process that is moving us in a positive direction.
In that case, we will not find the reason in order to eliminate it, but find the reason to change the process accordingly. However, if it is a 'negative' variation, we need to find the reason for this change and work to eliminate it.
(Note, other signals also need to be watched on the control charts. We can't go into all the details in this short article.)
More Resources on Statistical Process Control Charts
To gain a deeper understanding of statistical process control and the benefits of control charts, I recommend these two books by Donald J. Wheeler – Understanding Variation and Understanding Statistical Process Control. Despite their dry textbook appearance, Wheeler’s books are accessible and suitable for anyone, even those without a strong understanding of statistics.
To start setting up SPC in your own facility, take a look at our 7-Step Guide to Set Up Statistical Process Control on Production Processes.
Click below for a free webinar on reaching Sig Sigma Level.